

Core Features
Error Tracking
Automatically captures JavaScript errors, network request failures, resource loading errors, and other issues, providing detailed error stack traces and contextual data
Error Reporting
Supports both automatic error capture and manual error reporting, allowing you to record handled errors in business logic with additional context information
Error Grouping
Groups similar error events into the same Issue, reducing duplicate alerts and helping development teams identify and handle problems more efficiently
Source Mapping
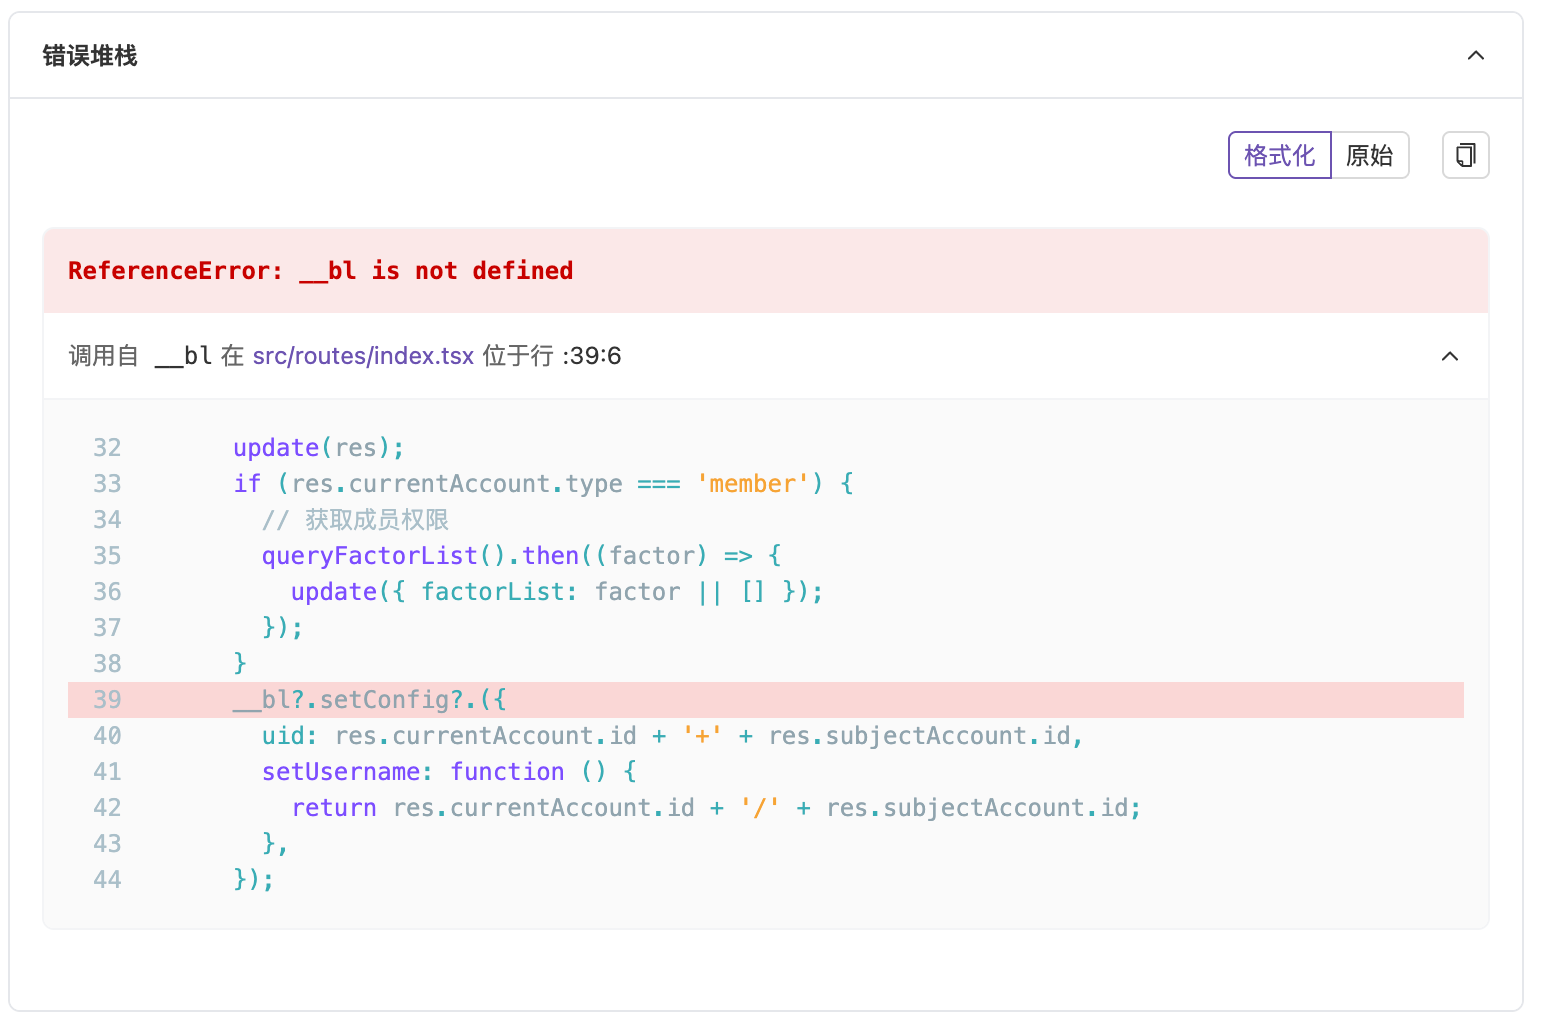
By uploading SourceMap files, maps minified code to original source code, directly locating the specific position in the original code
Value and Benefits
Use Cases
Frontend Development Debugging
Frontend Development Debugging
During development, quickly locate and resolve errors in JavaScript code, improving development efficiency.
Production Environment Monitoring
Production Environment Monitoring
Real-time monitoring of errors in production environments, timely discovery and handling of potential issues, ensuring system stability.
User Experience Analysis
User Experience Analysis
Understand issues users encounter during use, make targeted product improvements, and enhance user experience.
Error Tracking Workflow
RUM error tracking consists of two key phases: Problem Discovery and Problem Localization.1
Problem Discovery
Quickly discovering error trigger points is the first step in diagnosis. RUM provides the following ways to help you identify problems:
- Data Analysis: View error rates, error types, and other data trends through the “Errors” tab in the Analytics Dashboard
- Alert Notifications: By enabling alerts in the application and linking with channels, you can be notified immediately when errors occur
- Active Inspection: Observe error trends in the Error Tracking module, such as JavaScript errors, network errors, etc.
2
Problem Localization
RUM provides rich error data and contextual information to help you precisely locate the root cause.
Core Error Data
Contextual Information
- User Environment: Browser type, device model, operating system
- Error Stack: Detailed call stack information
- Session Timeline: Operation path that triggered the error
Problem Classification and Localization
Problem Localization Tools
- Error Analysis Panel
- Source Mapping
Through the error analysis panel, you can view the aggregated Issue list, error trends, and detailed information.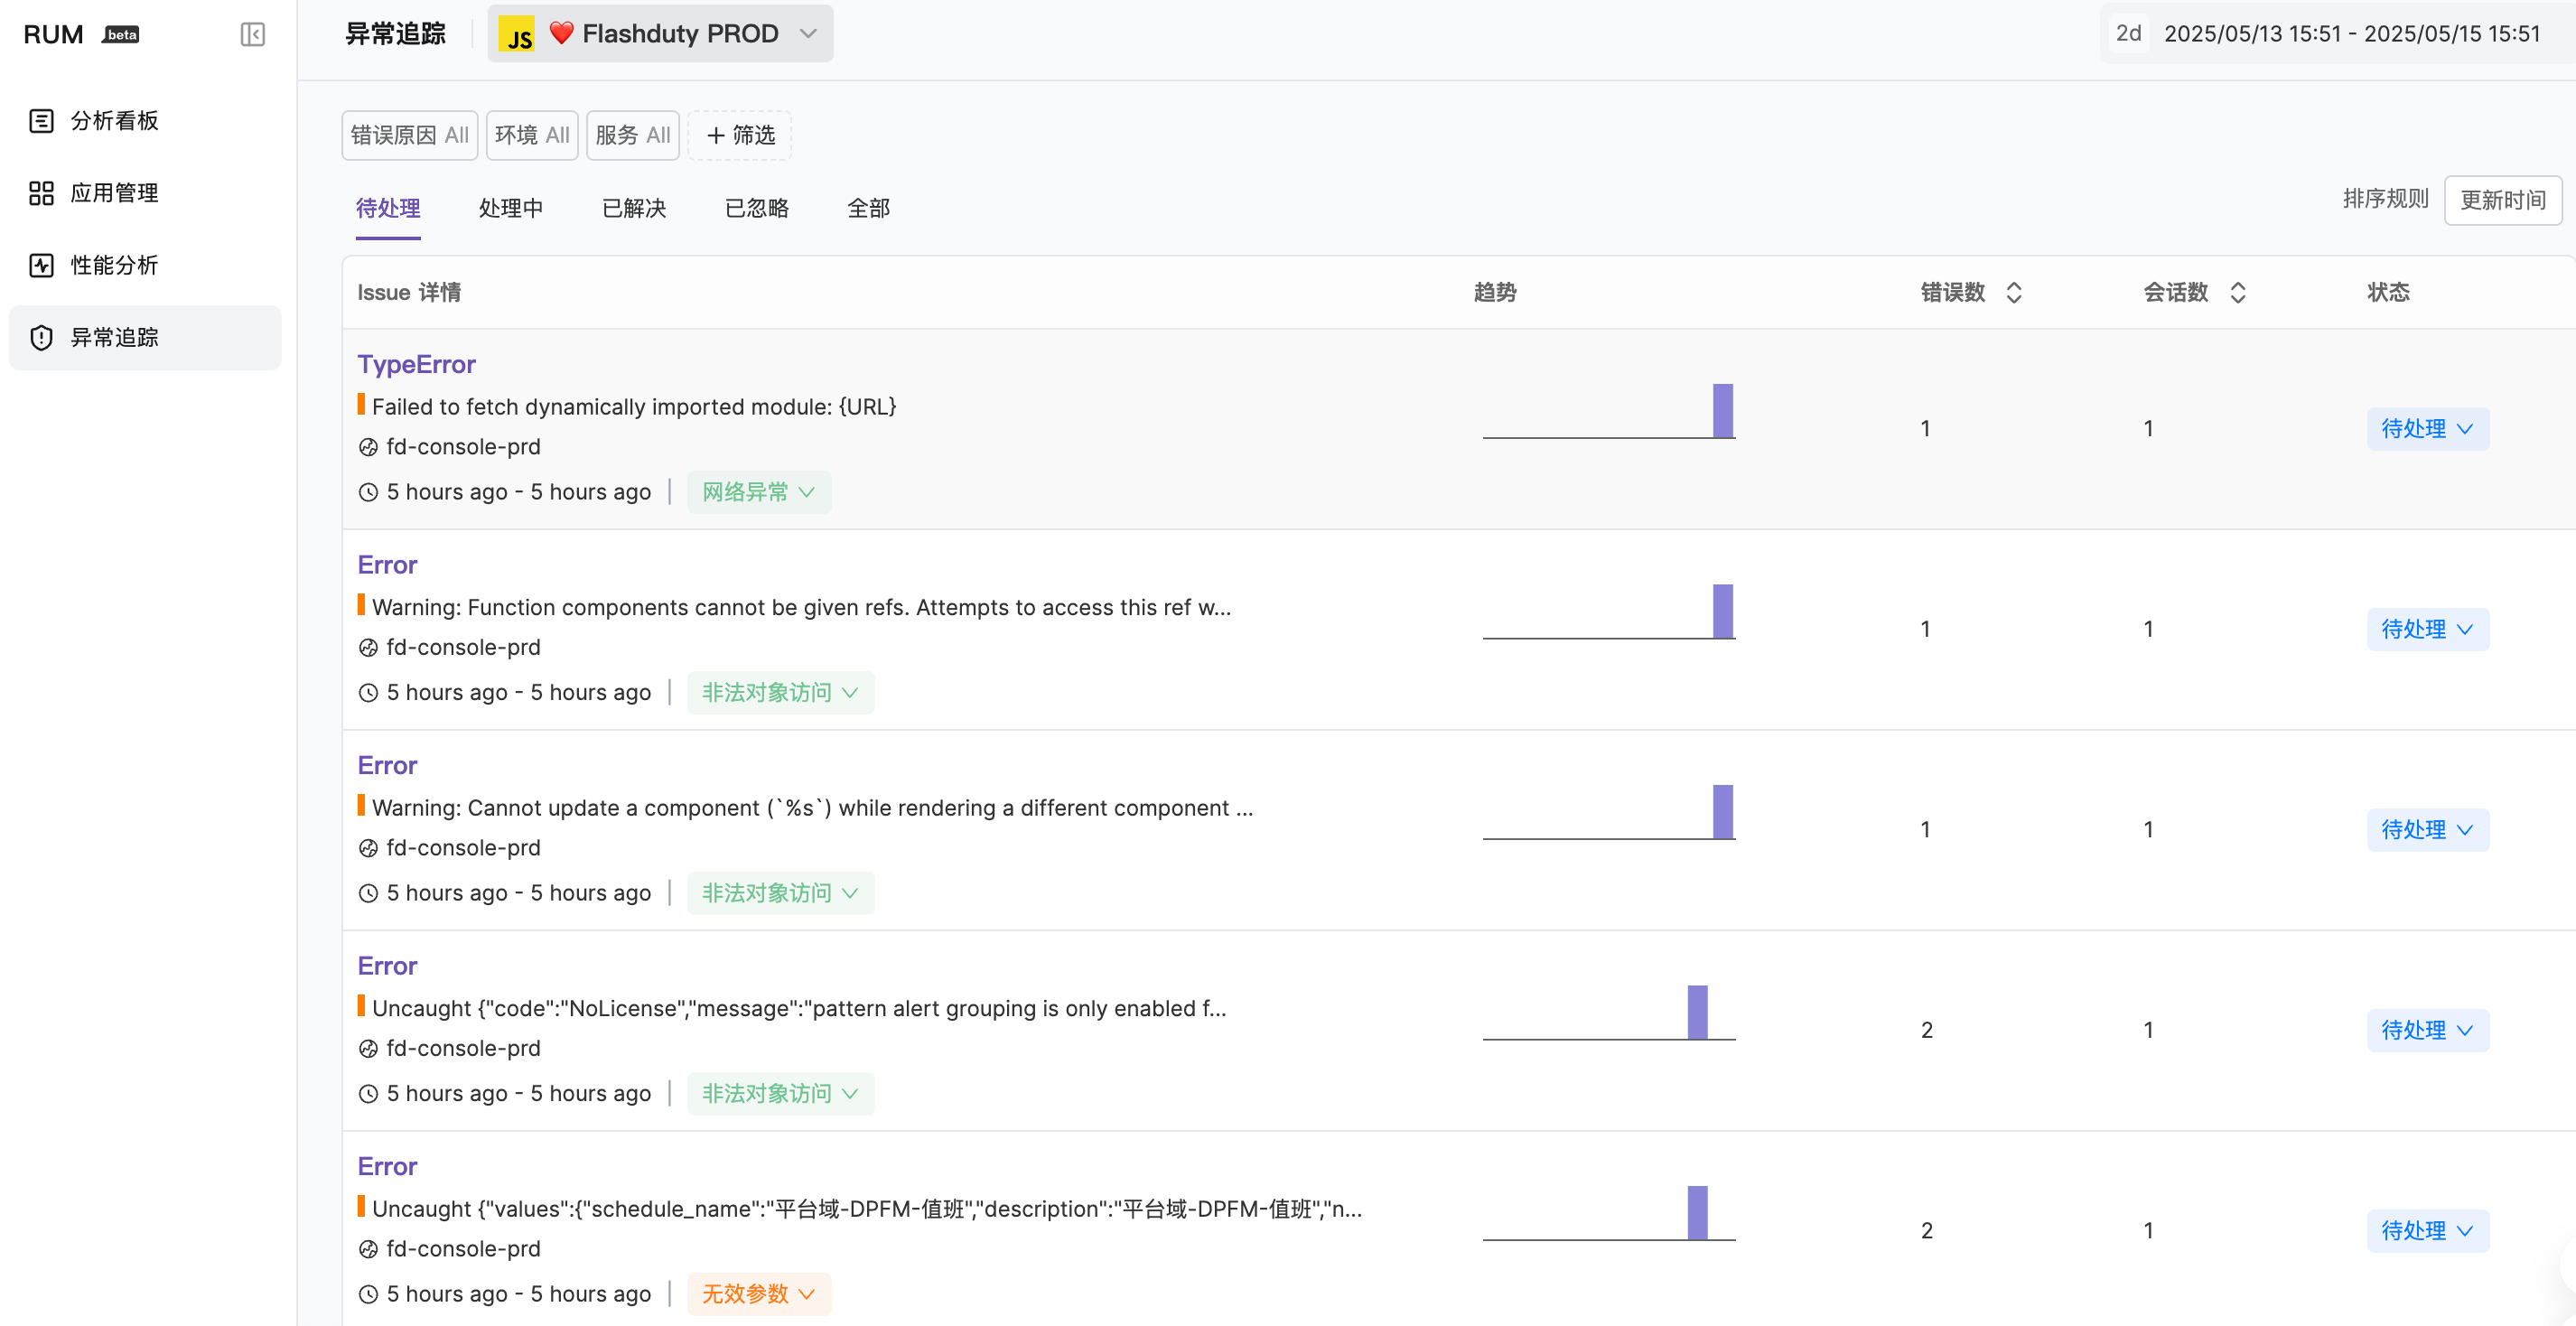
Next Steps
Error Reporting
Learn about error reporting rules and methods
View Errors
View and analyze error details
Source Mapping
Configure source mapping to improve debugging efficiency
Error Grouping
Learn about error grouping mechanisms